
Private
Real Estate
April 2026
Overview
Real Estate (“RE”) is an alternative asset class involving the developing or buying, renting out and selling of properties. As of early-2025, it is the world’s most valuable asset class, with its total value estimated at US$393 trillion. This is larger than the combined value of equities, debt and gold.
Value in RE is primarily generated via 2 channels:
-
Capital appreciation: The increase in a property’s market value over time, realised upon selling it
-
Rental income: The revenue received from leases, realised regularly during the holding period
Southeast Asia (“SEA”) is a relatively small but increasingly attractive market for RE investment. According to EY, RE made up 11% of SEA private equity (“PE”) investment value and made up 2 of the region’s 4 largest PE-backed exits in 2025.

In the first article of this 2-part series, we will unpack the structural reasons why RE has become an integral part of SEA PE activity and analyse trends in SEA by type of RE asset. We will also walk through a sample model of a United States multifamily residential property called Arcadia Gardens from Mergers & Inquisitions to understand how investors model RE asset acquisitions, with additional analysis regarding valuation considerations in SEA. Our second article will be a feature piece about the exciting data centre sub-sector in the RE market, unpacking the growth drivers and potential challenges behind SEA’s push to become a major digital infrastructure hub.
1. Market Analysis
1.1. RE in SEA
RE is a cornerstone of the SEA PE market. This is in contrast with more mature PE markets in North America and Europe, where deal volume is concentrated in traditional corporate buyouts. This regional divide can be attributed to the following reasons:
Defensive assets hedge against larger economic fluctuations
SEA generally consists of small and open economies which are highly susceptible to macroeconomic fluctuations such as inflation and exchange rate volatility. These fluctuations create ripple effects throughout supply chains, making it difficult for companies to forecast demand and prices. Moreover, revenue and expenses from abroad are usually denominated in foreign currency, further exposing EBITDA to exchange rate risk.
These conditions make it difficult for SEA to sustain high levels of corporate leveraged buyout (“LBO”) activity. LBOs rely on forecasting EBITDA growth over the short-to-medium term to determine the eventual exit value, which constitutes a significant proportion of equity returns. In a region with regularly uncertain macroeconomic outlooks, investors find it difficult to rely on growth prospects. Furthermore, equity returns during the holding period are usually minimal at best, possibly featuring opportunistic dividend distributions.
In contrast, RE assets offer higher certainty and downside protection. Tenancy is generally contracted over the short-to-medium term, offering better visibility over recurring revenue. In the event that tenant contracts expire, RE is a more essential good than many goods and services that corporates provide (e.g. consumables), increasing the likelihood of successful re-leasing. Moreover, rental payments represent regular cash flow returns to investors, thus investors are not as reliant on a strong exit value to recover their investment.
Tangible assets are easier to claim in jurisdictions with weaker rule of law
World Bank’s Rule of Law estimate captures how much agents have confidence in the enforceability of legal obligations, such as contract enforcements. Scores range from approximately -2.5 (lowest) to +2.5 (highest). SEA’s average rule of law is negative at -0.05, with only Singapore having a score higher than 1.0. Excluding Singapore, SEA’s average rule of law drops below Central America to -0.25. Many SEA countries are plagued by corruption and weak governance. In such an environment, investors look to real assets like RE, where even if contractual cash flows cannot be enforced, the tangible assets (property and land) still store value which can be independently appraised, and can be sold or re-developed.

REIT listings provide predictable exit opportunities
A Real Estate Investment Trust (“REIT”) is a vehicle that holds a portfolio of RE assets. REITs often provide investors with more diversified RE exposure than standalone properties, further de-risking RE investments.
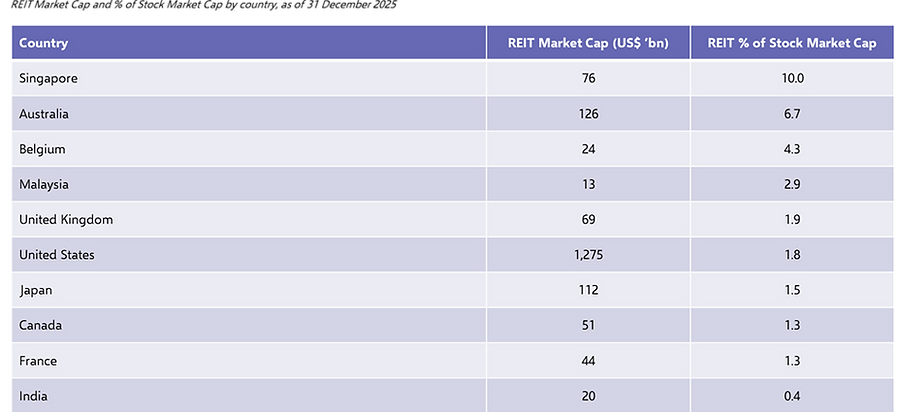
While listed REITs are a relatively novel concept in SEA, they have become increasingly popular as a way for developers to exit several RE assets at once into the public market. This exit avenue has become especially important in a muted SEA exit market, featuring limited liquidity in the capital markets and a sharp decrease in exit value. Public investors look to REITs for their attractive income-generating potential, particularly in Singapore where REITs are required to distribute minimally 90% of taxable income to unitholders. REITs account for 10.0% of the Singapore Stock Exchange’s market capitalisation, far higher than any other country in the world.
1.2. Types of RE assets
RE assets can broadly be categorised into three types:
Residential
Residential properties encompass RE occupied by the general public for living purposes, such as multifamily apartments. Leases are generally shorter and occupancy features higher turnover, as people’s lives and housing needs change frequently.
Demand is buoyed in SEA cities with rapid urbanisation and population growth. For instance, regional RE investor Mapletree is targeting Ho Chi Minh City, where surging demand by the middle-class especially for mid- and high-end condominiums have caused price surges of 57% from 2019-2025.
Commercial
Commercial properties consist of RE designed for business activity, including office buildings, industrial, manufacturing and retail. Businesses have the capital to sign longer and higher-value leases, thus commercial properties generally have the potential to attract higher yields than residential ones.
Demand is dictated by the type and volume of business done in the area. With its business-friendly environment and highly skilled workforce, Singapore attracts interest from companies looking to occupy high-tech industrial facilities. In 2024, Warburg Pincus and Lendlease acquired a S$1.6 billion portfolio of Singaporean industrial assets, housing tenants from blue-chip companies in technical fields such as life sciences and technology. Meanwhile, many SEA cities have developed strong manufacturing capabilities due to the relatively cheaper land and labour costs. Penang has earnt a reputation as the “Silicon Valley of the East” for housing many high-value semiconductor manufacturing facilities. Malaysia was one of the preferred choices for many companies to relocate their manufacturing facilities away from China to reduce exposure to the US-China trade war, particularly due to its neutral geopolitical stance.
Alternatives
Alternative properties exist for highly specialised purposes, such as data centres and healthcare facilities. Leases can be even longer than commercial properties, since businesses require the property to fulfil a niche function that may even be tailored to the specific needs of the tenant.
Demand is dictated by business trends that drive demand for the niche. In recent years, data centres have exploded in popularity in SEA. On the demand side, SEA features rapidly expanding digital economies and growing urban populations accelerating the need for data connectivity. On the supply side, SEA offers a relatively competitive cost profile, strong undersea cable connectivity, and close proximity to major economies, thus building large data centre facilities is economically feasible. Our upcoming feature article on data centres will delve deeper into the sector.
2. Valuation and Financial Analysis
Using the adapted model from Mergers & Inquisitions, this section will illustrate how investors think about financial metrics when evaluating an RE acquisition.
2.1. Operational Metrics
2.1.1. Revenue Build
Rent is overwhelmingly the primary way that REPE investors generate income. It acts as a much more consistent and predictable source of returns for investors than dividend distributions, which fluctuate depending on the performance of the company.

Revenue calculation involves the following key line items:
Base rental income
Base rental income is determined by the market rent price per rentable square feet, multiplied by the total amount of rentable square feet in the facility. It represents the maximum potential income a property can earn from rent if all rent was charged at market price. This pricing method is common because the developer has incurred costs to acquire and develop each square foot, and because the size of the rented property is a common denominator that all tenants consider when evaluating property.
Rental projections are usually pegged to the country’s inflation rate, as a macroeconomic indicator that reflects a general increase in nominal income and the Consumer Price Index (“CPI”). Particularly when renting to businesses, investors insert a “CPI rent escalation” clause in the contract to ensure that their rental income is not eroded by inflation.
Loss to lease
Loss to lease is calculated using the delta between market rent and in-place rent (ie. the rent actually charged to tenants), multiplied by the total amount of rentable square feet. It represents the “lost” income a property has foregone by charging at the in-place rent rather than the market rent. The delta exists because tenants agree on a contractual in-place rent several years in advance, while market rent is subject to market fluctuations. Generally, as the market trends upwards over time, in-place lags behind and is usually lower than market rent price. Netting off loss to lease from base rental income gives the potential gross income that can be earnt on the property, assuming all units are rented.
Investors closely monitor this delta when assessing a potential investment. Investors interested in income growth strategies may look for property where the in-place rent price is lower than the market rent price, with the potential to raise rent prices in line with the market upon re-leasing. Investors interested in predictable, consistent income may look for property where the in-place rent price is consistently in line with the market rent price, reducing how much future returns are dependent on predicting the markets.
General vacancy
Not all units may have a tenant. General vacancy rate captures the percentage of rental space which is not rented. Netting off general vacancy from potential gross income yields the effective gross income the property actually earns.
To maximise predictability of income, investors wish to maintain a low and steady general vacancy rate. Investors often stagger lease expiry periods to ensure that many leases do not expire at the same time (known as “cliff years”), resulting in a sudden drop in rental income. One of Singapore’s most prominent REITs, Capitaland Ascendas REIT, maintains a diversified lease profile to minimise this risk.-ascendasreit.com/misc/CapitaLand-Ascendas-REIT-AR2024.pdf

2.1.2. Expenses Build
Unlike goods-based business models, RE assets usually incur a lower ratio of direct to indirect expenses as there is less marginal cost to an investor associated with renting out an additional unit. Direct expenses thus primarily go towards maintaining the property and ensuring every unit is in rentable condition.
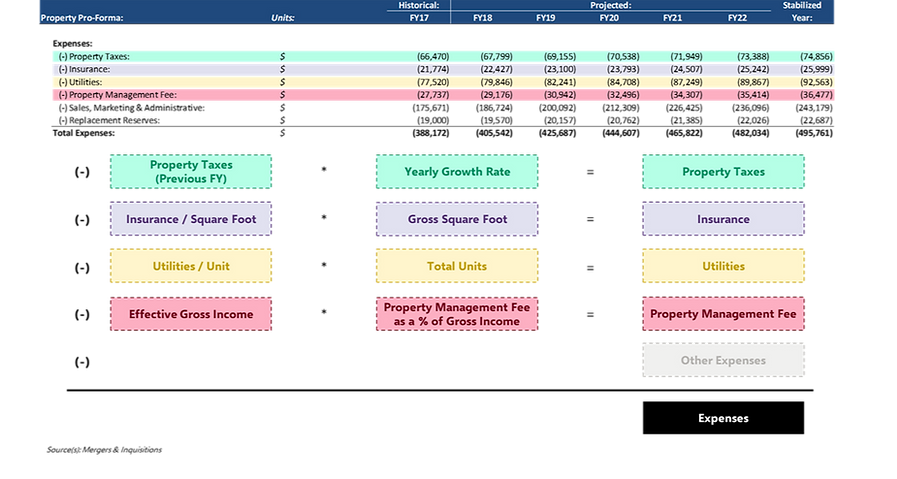
Key direct expenses as reflected in the model include:
Property taxes
Property taxes are typically levied by local governments based on the assessed value of the property and represent a recurring cost of owning RE. Rather than a typical corporate finance model where projections depend on a yearly fixed rate against pre-tax profit, the sample model forecasts a property tax yearly growth rate. This is because property taxes are recalculated based on its fair market value, which generally appreciates year-on-year. Investors thus monitor property tax growth closely, particularly in jurisdictions where reassessments occur frequently or where tax policy is subject to change.
Insurance
Insurance protects the property owner against property damage. It is typically priced as cost per gross square foot insured, as each additional square foot represents additional rebuild costs. While insurance costs are usually predictable, they may rise rapidly if the building is located in an area prone to natural disasters, increasing the risk of structural damage.
Utilities
Utilities include services such as electricity, water, heating, and waste management that are necessary to maintain the functionality of the property. A property will have a mix of fixed utility costs (e.g. lift and lobby electricity), and variable costs (e.g. electricity and water bills per tenant). This model assumes that tenants are wholly responsible for their individual unit’s utility bills, and thus the property owner’s utility costs are multiplied against total units, not total rented units.
Property management fee
Property management fees compensate third-party operators or in-house management teams responsible for the day-to-day operation of the asset, such as tenant relations and rent collection. This can be considered a rare line item that scales as a small percentage of yearly asset income, since operational load increases with each additional unit rented.
2.2. Financing Metrics
RE tends to be financed with a higher degree of leverage than typical corporates. This is primarily because RE generates stable, contractual cash flows via long-term leases, and is backed by tangible collateral. These characteristics provide lenders with reliable downside protection and recourse in case of default.
When underwriting RE transactions, lenders often agree on certain financial covenants with investors to ensure the investor does not over-leverage the asset, providing the lender with more assurance that their debt will be repaid. An investor must thus track these covenants closely in their model. Common financing covenants in RE deals include the following:
Loan-to-Value (“LTV”) Ratio
The LTV ratio measures how much of the property’s purchase price is financed through debt, as a percentage of the asset’s value. A higher LTV ratio amplifies upside via reduced initial equity contributed, yet amplifies downside via fixed debt obligations. Unlike the subsequent metrics, LTV is specifically used in fixed asset transactions. In RE loans, lenders take greater comfort in the asset’s collateral value itself, thus LTV essentially measures how much of the recoverable value is risked by the lender.
In SEA, the banking market is concentrated among a few large regional players, which operate on a wholesale model and hold billions of critical deposits from retail customers. Due to their national importance, such banks are usually placed under strict regulations to be disciplined with their lending activity. With its stability and security, these banks view RE deals as one of the most attractive to underwrite. DBS Bank, SEA’s largest bank by assets under management, showed nearly half of loans secured by RE made in 2025 in the >50% Loan-to-Value (“LTV”) range.
[1] https://www.dbs.com/iwov-resources/images/investors/annual-report/dbs-annual-report-2025.pdf

Debt Service Coverage Ratio (“DSCR”)
DSCR measures the ability of a property to cover its debt obligations, calculated as Net Operating Income (explained under “Valuation Metrics”) divided by total debt service (interest and principal repayments). It represents how many times a property’s cash flow can be used to service debt.
Lenders to RE investors agree on a comfortable DSCR level in the covenants and multiply it by yearly NOI to size the maximum loan that the property can support.[1] This in turn affects the LTV the investor can take on, affecting their equity returns.
Interest Coverage Ratio (“ICR”)
ICR measures the ability of a property to meet its interest obligations, calculated as Net Operating Income (“NOI”) divided by interest expense. ICR provides a narrower view than DSCR by focusing solely on interest payments, thus it is particularly relevant in scenarios such as refinancing where large amounts of principal repayments may be deferred.
2.3. Valuation Metrics
NOI / Capitalisation Rate (“cap rate”)
NOI functions similarly to EBITDA, reflecting the annual profitability of the asset before financing and capital expenditure. Cap rates reflects the annualised yield on a property.[2] Investors divide the 1-year forward-looking NOI by a cap rate at entry and exit, to assess the property’s value. The assumption is that the price reflects the property’s value should the NOI be at a stabilised constant value infinitely into the future, discounted at the cap rate. This valuation method differs from a Gordon Growth model used in Discounted Cash Flow (“DCF”) models, where free cash flow in the last forecasted year is projected to grow at a constant yearly growth rate infinitely. This discrepancy arises because NOI in RE is more predictable than FCFs in corporates, thus investors tend to look at RE cash flows on a steady-state basis.
Investors determine cap rates by benchmarking against comparable transactions for similar properties as well as surveying macroeconomic conditions. Much like the Weighted-Average Cost of Capital (“WACC”) used in DCFs, higher interest rates or higher risk profiles lead to higher cap rates, as investors require a higher rate of return on their investment as compensation.[3] Whether investors prefer a higher or lower cap rate upon entry depends on how much risk vs reward they are willing to accept.
In general, investors want a lower cap rate upon exit compared to entry to boost exit value. However, given the difficulty of estimating an exit cap rate, the sample model has chosen to be conservative and project a relatively similar cap rate upon exit.

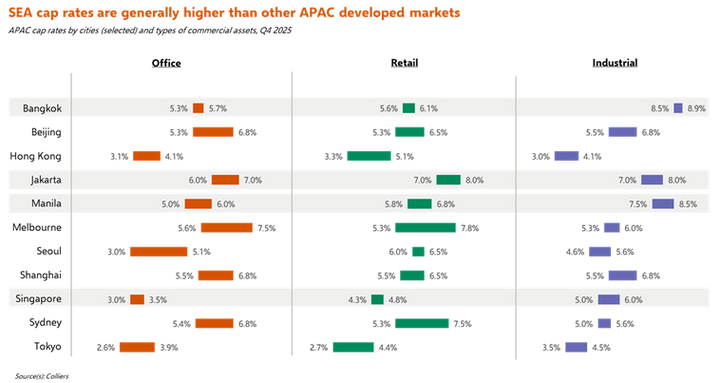
Cap rates are generally fairly high in SEA , reflecting the larger degree of investment uncertainty. However, this observation differs across countries and asset types.
For the residential market, Singapore exhibits the highest level of maturity, with net yields (cap rates after expenses) in prime areas ranging at a stable 1-3%. Extreme land scarcity in prime areas alongside high demand from the ultra-rich have pushed prices up, lowering cap rates. Investors are instead chasing attractive yields in growth markets in Indonesia and Thailand, where cap rates can reach up to 8%.
For the commercial market, Singapore matches several developed Asia-Pacific (“APAC”) cities across prime office, retail and industrial assets. Singapore’s office and retail assets are highly established with consistent demand, therefore reflecting low cap rates with low variance. While industrial assets typically feature higher cap rates as data centres (classified under “Industrial” by Colliers) are more unproven, Singapore remains competitive and only slightly trails data centre powerhouses like Sydney and Tokyo. Other SEA markets carry higher growth potential and thus tend to skew higher in terms of cap rates. Bangkok’s industrial sector features the highest cap rate across the selected cities due to its nature of its data centre sector, only recently growing with the city’s surging demand for e-commerce.
2.4. Returns Analysis
Putting it all together, an investor will use entry price, yearly equity returns (NOI after debt payment and capital expenditures), exit price and final debt repayment (sized based on LTV) to calculate the Internal Rate of Return (“IRR”), the annualised equity return on the asset. Unlike corporate LBOs where cash flows to equity holders are minimal during the holding period, yearly equity returns are consistent and represent a noticeable minority of returns, demonstrating the income-generating potential of RE assets.

Authors:
Vernon Goh
Vansh Goel (Associate AY 25/26)
Jatin Singh Kodial (Associate AY 25/26)
Ishita Gupta (Analyst AY 25/26)
Zhao Junyu (Analyst AY 25/26)